SWIFT action: Can Europe dump Russian energy imports? (Part 3)

Uncategorized

Recap: In Part 1 we saw just how dependent Europe is on Russian gas (38%), coal (46%), and oil (23%). Russia’s energy sector accounts for 40% of it GDP, so taking that away can work to halt the war machine. In Part 2 I proposed some short-term measures that can take the EU a few steps toward energy independence: starting up recently shut down nuclear units and stations, and re-supplying a proportion of gas from increased LNG export capacity in the US.

Now let’s create a best-case scenario to make the EU’s energy sector independent of Russia (and cleaner!) within the decade. It involves a lot of new generation from non-fossil sources, some efficiencies, and a lot of resupply from friendly partners.


Fossil fuel usage by sector

To come up with a plan we’ve got to look at how energy from fossil fuels is used across Europe. The data from Eurostat offer an exhaustive breakdown, so I will aggregate into four groupings that we can plausibly tweak with central planning and behavioural adaptation: energy generation, industry, transport, and household use.

Fig 1: Fossil energy usage in energy generation, transport, industry, and at home.

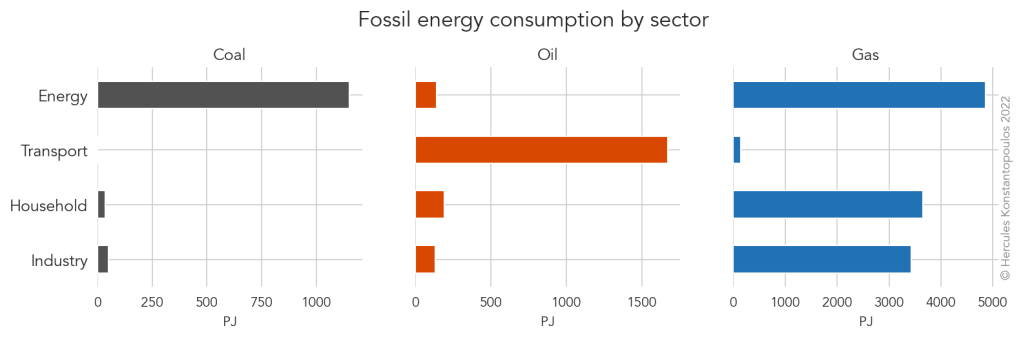
Coal and oil are dominated by a single sector, but gas is more widely used. Let’s look at each fuel.

Coal

In terms of end use, there are two kinds of coal: metallurgical (black) coal used in coke ovens to turn iron into steel; and lower grade thermal (black and brown) coal used for energy and electricity generation. In Part 2 I suggested that we turn to Australia to swap the Russian coal supply. Let’s take a closer look at the data from Geoscience Australia.

Thermal coal dominates the fossil mix of Europe, with 36 Mt (Mega-tonnes) imported from Russia. This equates to 17% of Australia’s 2019 export of 210 Mt. That seems impossible to replace in a single transaction, but can we pencil a quarter of that to Australia plus other friendly nations? From Part 2 we know that Australia has reachable reserves of roughly 1750 years’ worth of Russian imports to the EU… they’re good for it and according to multiple Prime Ministers, they love digging up the stuff!

Maybe we can more easily offset coking coal. That’s 10% of the coal EU consumption, or 122 Mt. Thankfully, only 4 Mt came from Russia in 2020, which equates to 2% of Australian exports (0.9% of their 460 Mt of production). Let’s lean on Australia to provide all those 4 Mt.

This re-sourcing from Australia (and other friendly producers) immediately removes 30% of Russian coal imports. Now let’s model re-sourcing the remainder at 10% per year. We’ve removed all the coke coal in 2022, so we gradually remove thermal coal.

Fig 2: Coal reduction scenario almost eliminates Russian imports by sourcing from Australia.

Oil

Imported crude oil is mostly shipped to refineries to become transport fuel. We can’t swiftly shift road transport: EVs are an obvious way out, but that’s just shifting the problem to electricity generation, which is still largely fossil-driven.

What about a 10% reduction through efficiency measures? Everybody takes nine trips in 2022 for every ten they took in 2021… it seems like an achievable wartime sacrifice. What else? We found out during Covid that a considerable part of the economy is able to operate with remote (desk) workers. This would help reduce oil for commuting. In 2020 Europeans burned through 232 Mt of fuel for transport, and imported 171 Mt from Russia. This 10% reduction in transport oil requirement would offset 14% of Russian oil import.

What about household use? Oil is used for heating and hot water through diesel-powered boilers in people’s basements. It’s outdated technology but it is expensive to swap for a viable, modern alternative, such as a heat pump or a wood pellet burner. Europe used 30 Mt of heating oil in 2020. Roughly equating that to two tonnes per home (that’s what we burned in the mountain home where I grew up), we get around fifteen million homes.

Can we immediately shift a third of that to heat pumps and wood pellet burners? Five million installations in a year sounds bonkers, and I am no expert on logistics and supply lines for this machinery. Wood pellet burners are made in Europe, as are some heat pumps (here in New Zealand they tend to be made in Japan), and there is capacity on the EU grid for 50 million heat pumps, so we are not breaking the electrification bank!

As an aside, I am a big fan of Saul Griffith’s message of the wartime-like mobilisation it will take to electrify the world—heat pumps being one of his main recommended tools. Seeing as we are in wartime, we can drop the “-like” from this verbiage and get to building heat pumps and wood burners.

What does that do? 19% of Russian oil offset by efficiency plus electrification and fuel-swap measures. Let’s model this time series by removing 20% of the remainder for heat pumps and wood pellet burners each year.

Fig 3: Oil reduction scenario through efficiency and electrification measures.

That’s considerable, but still a small dent from efficiency and electrification. Transport fuel is hard to move so the rest will have to come from re-supply. Let’s remind ourselves what proportion of production we’ll need from other partners: in Part 2 we worked out that the EU would need the equivalent of 15% of production from the US and Saudi Arabia, and 20% of Norway and the UK, which might be too much to ask (happy to be wrong!).

To make that feasible let’s ramp up gradually. If we start with 5% of production from each partner (adding up to 57 Mt) we can offset a third of Russian imports. Let’s now take into account the reduction scenario above, and on top of that apply alternative sourcing: 5% in 2022, and step up 1% each consecutive year.

Fig 4: Oil resupply scenario, contrasting the ramp-up of supply from partners other than Russia to gradual efficiency gains.

The combination of new supply partners and replacement of houselhold oil-fuelled boilers with heat pumps and wood pellet burners harmonises in 2028. After that point no Russian imports are required at all. How much Russian oil does this scenario require?

Fig 5: Diminishing requirement for Russian oil imports under the scenario of Fig 4.

We drop to 44% immediately, and then 10% per year to hit the bottom of that oil barrel in 2028. Oil is the main money-maker for Russia (even though they provide more gas). We can work out what these lost exports are worth in 2020 money. Keep in mind that (bulk) supply contracts will keep their value, but the spot price will change: with prices for Russian oil already showing signs of decline, this amount might end up being less.

(Side-note: even as Shell announced its exit from shared interests with Gazprom, it then bought Russian oil just one week into the conflict. Welcome to the complex and eye-wateringly frustrating world of energy).

The loss of income starts at €25 billion (in 2020 money) and increases by €3b each year. In 2022 that is €69 million per day in lost income for Russia.

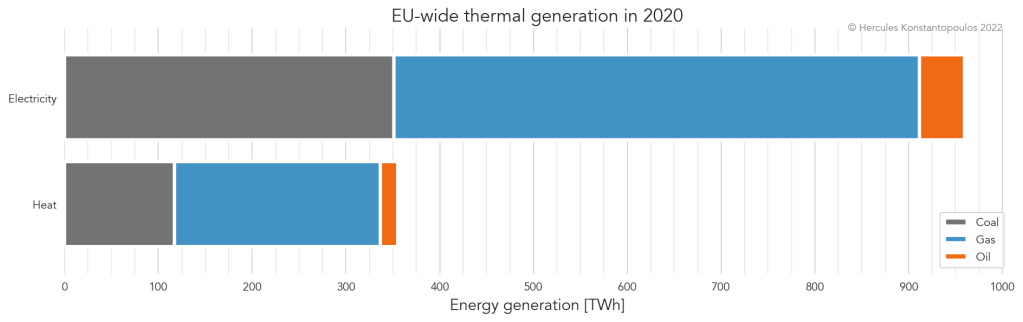
Gas and electricity generation

This is where the complicated nature of gas supply and usage comes into play. This section will get a little dense, so in a nutshell this is how I will construct my toy model:

  • Check what stations are meant to come online this year and assume they will.
  • For renewables, look at every record installation year and use as an optimistic baseline for annual increase.
  • Connect Iceland’s geothermal generation through a submarine cable to the UK.

Low-carbon generation history

To get an idea of how much low-carbon generation we might install, let’s refer to historical data:

Fig 6: Installed capacity of non-fossil generation per year and cumulatively; and efficiency of generation over time.

Lots to take in here. On the left we have capacity installed each year since 1990 for wind, solar photovoltaic, geothermal, and nuclear energy generation. The middle plot shows the complement (generation fleet) over time. And on the right we have the efficiency as the actual energy (GWh) produced in a year divided by the nameplate (GW) capacity times a year’s worth of generation. (Geothermal is a funny one as its energy can be used twice: once the electricity is dispatched, the hot geothermal ‘brine’ can be piped away from the plant for direct heat applications, such as home heating or industrial process heat. That makes its efficiency greater than 100%. Isn’t that cool?)

From this we can get the maximum plausible annual installation rate for new capacity. For solar and wind we get 22GW and 12GW respectively. We also have the EU pledge to increase wind capacity to 350 GW by 2030. Let’s work backwards from that number and evenly apply the excess needed to reach the goal. We had 177 GW of wind installed in 2020, meaning the EU aspires to add 173 GW in the coming eight years, or 21.6 GW per year. Let’s be ambitious and make it so (in our model, but hey, IRL too).

We can now use the above efficiencies to turn GW into GWh or PetaJoules (PJ) over the course of a typical year. An important caveat: from now on, when I compare electricity generation from renewables to that from fossils, I will be applying the thermal-to-electric conversion efficiency of 39%. This is a huge advantage of electrification from primary fuels: the photovoltaic effect for the Sun; the direct spinning of a generator by wind; and splitting atoms for nuclear. In other words we get a whole 1 Joule for every 0.39 Joules of fossil electricity we offset. Bonus!

With that conversion in mind, those roughly 45 GW per year of new wind and solar can offset 10% of fossil generation from Russian imports. That’s each year. It’s amazing.

Future nuclear

Let’s go back to this source to look for stations and units scheduled for completion this decade:

CountryStationCapacity (MW)Completion date
FinlandOlkiluoto1,6002022
FranceFlamanville1,6002023
SlovakiaMochovce8802024 (assuming 15 years in construction)
UKHinkley C3,2002028 (assuming 10 years in construction)
Table 1: Expected nuclear generation in the coming decade.

The completion dates for Olkiluoto and Flamanville come from the source. For the other two I have assumed the historical average construction time in each locale.

Given the efficiency derived from Fig 6, plants coming online in 2022 and 2023 can each offset 2% of Russian-imported gas. Mochovce can offset 1%, and Hinkley can offset a mammoth 4%.

The IceLink cable

As I sat down to hypothesise whether a submarine high-voltage direct current (HVDC) cable between Iceland and the UK would be feasible, I found out this is in planning as a 1.2 GW connection.

There are two factors to consider: geothermal potential, and linkage distance.

This industry source claims Iceland can double its generation in an environmentally friendly way. There are about 3 GW of installed electricity generation right now, so there is potential for another 3 GW. The 1.2 GW HVDC des not seem too far fetched.

What about the cable itself? It’s about 1,000 km from Reykjavik to Scotland. This seems quite feasible when compared to the existing, 610 km long Interisland connection between the two islands of New Zealand. (Sun Cable, a planned connection between Australia and Singapore will run 5,000 km). Interisland took four years to construct in the 1960s, so it should be at least as fast to do this now, with bigger and better spool-carrying boats.

Let’s jot that down as 1.2 GW (350 GWh) for 2026 in an ultra-optimistic model. (I’m keeping the >100% efficiency; even though only the electrical segment is beamed through the cable, the excess will be used locally, and it’s a rounding error in the grand scheme).

A model for eliminating Russian fossil imports this decade

We have four sources of newly installed capacity: Solar is assumed to be installed at the peak rate, every year; wind follows the EU’s 2030 goal; nuclear follows the programme laid out above; and IceLink is assumed to come online in 2026.

Fig 7: Following historical trends and announced projects we get a massive increase in non-fossil generation by 2030.

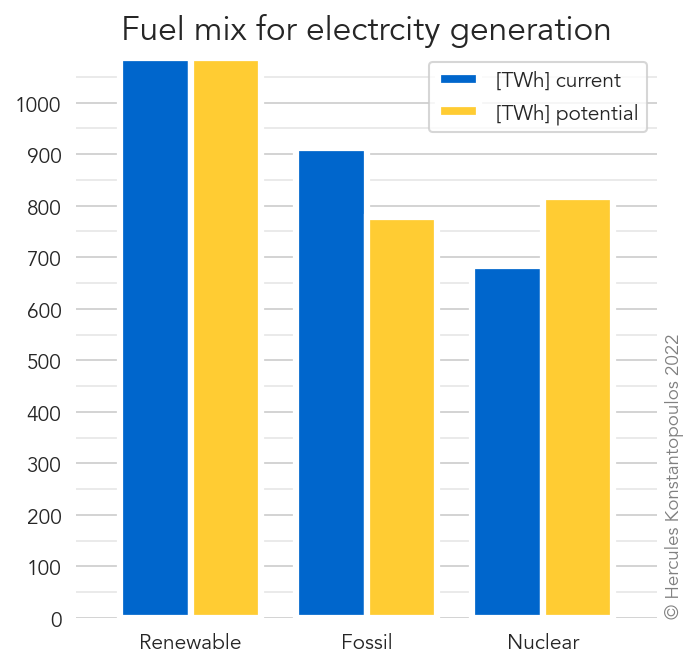
That’s quite a marvellous vision for Europe, energy independence from Russia aside, the emissions reductions will be off the scale! And it’s not just Russia, this make Europe much more self sufficient overall.

Those are some encouraging numbers, but how do they compare to electricity generation from Russian fossils? Recall that in Part 2 we be replaced a bunch of gas with American LNG. Starting with that, let’s make a time series of further reductions, assuming we can re-source supply by 10% of the remainder each year. Then we can add up Russian coal and gas to a fossil generation bundle—oil is used for transport so it stands alone, not going past Fig 5.

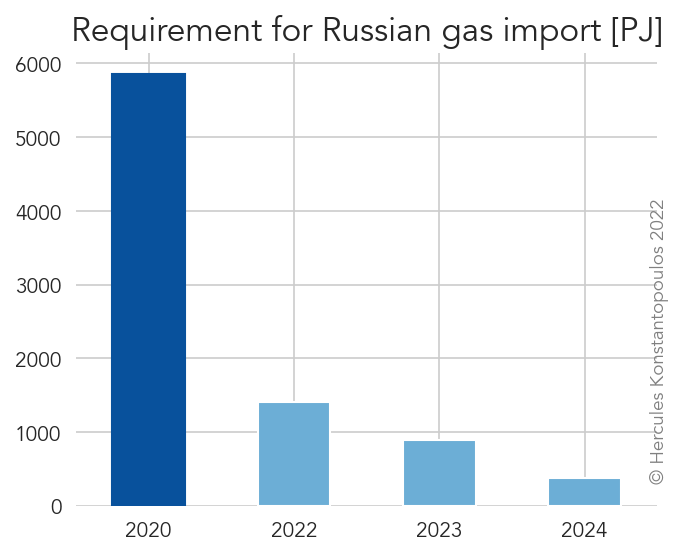
Let’s plot the reduction model from re-supply against the rise of new non-fossil generation:

Fig 8: Coal and gas reduction and resupply scenario, contrasting the ramp-up of low-carbon generation with diminishing supply from Russia.

New renewables and nuclear overtake electricity generation from Russian coal and gas in three short years. There are approximations and caveats here, primarily to do with the efficiency inherent in offsetting gas and coal used for electricity generation (recall that 39% thermal-to-electric conversion from fossils). The logistics are not as simple as I present here, they require a lot of shifting of gas between uses and sources, but this is in the realm of plausibility—it must be: as I go to press the EU is about to announce an 80% cut of their Russian gas import, and the US is moving to ban Russian oil altogether.

How much Russian gas does that leave?

Fig 9: Diminishing requirement for Russian gas imports under the scenario of Fig 8.

Let’s again translate that into cold, hard cash (with similar caveats about spot prices). The value of 2020 coal and gas imports from Russia to Europe was €11.6 billion. That annual Russian income of €11.6 billion is lost within three years in this scenario. Combined with €25 billion per year (and increasing) for oil, how many tanks will Russia be able to afford without that money?

An independent, low carbon future

In this series I’ve laid out a European model of energy independence (and incidental decarbonisation) that relies on changing supply lines in the immediate term; building renewable generation at record rates; and introducing efficiencies through electrification and relatively easy behavioural change.

An obligatory optimist’s view of our low-carbon near-future. West Wind, Makara, New Zealand; http://www.wildthings.club

The model assumes that the consumer is fully in control of this relationship. But the supplier really has all the power. If the Kremlin decides to turn off the tap there will be an immediate and deep shock to the system that will require commensurate behavioural change. Faced with an inability to heat a good proportion of apartments in Europe, cohabitation might be a decent emergency measure. If you have elderly parents and a spare room, don’t let them get pneumonia, have them live with you—and if you or they can still afford their rent, pay at least some of it so Europe’s landlords don’t all go bankrupt. Conversely, if you have university-age children, get them back home. Companies that fared well with remote work, keep that going (and again, maybe pay those landlords). Crypto bros: just stop it. In any case, that’s a broad conversation for another time. If it comes to that we’ll react, and I’ll write another analysis.

The good news is how quickly this toy model removes the requirement for Russian imports. It’s all achievable this decade. And the positive effects to the environment will be astonishing. You don’t have to care about renewables to appreciate the clean air and water (and self-sufficiency).

The impact on Russia

This whole project has been about taking away 40% of Russia’s GDP and defund the war machine. The opposition of at least some Russian people to this war is exemplified by the thousands who took to the streets knowing they would be arrested… and then who knows what. While their country’s first foray into democracy didn’t work out, I hope they make their way out of these hard times by keeping up pressure on their regime.

Russian people protest the war in Moscow; REUTERS/Evgenia Novozhenina.

Tough choices for the future we seek

The risk to humanity of an escalation to a new World War including multiple nuclear powers is immeasurable. You might not like a resurgence of nuclear energy, but the risk of fallout from nuclear warfare is total ecosystem collapse.

I am heartened by the swift action we’ve seen in the past two weeks. I’ve been very surprised to see leaders take charge—rather than polls and election feelers—and confront this monstrous invasion head on. Let’s see this through; energy independence is crucial to restore peace. Once we’ve got that in the bag, we can resume our work to make the world better—and all the carbon saved in the process will take us closer to that goal.

SWIFT action: Can Europe dump Russian energy imports? (Part 2)

blog, energy

In Part 1 of this series we saw that the European Union is dependent on Russia for a large proportion of its energy: 46% of coal, 38% of gas, and 23% of oil. These fossils are used to keep the lights on, power industry, heat homes, and move people and goods. It’s a big dependence and one that is becoming more scary and less palatable with each day of Russian bombing of Ukrainian cities and civilians. And it runs both ways: these pipelines are funding Russia’s war machine (EU energy imports accounted for 4% of Russia’s GDP in 2020[1,2]) and Russia can threaten to turn off the tap in wintertime when people need heating the most. What can Europe do to lessen this dependence?

I’ll spoil the plot in case you’re busy: This is a scary situation, but there is a way to decrease Europe’s reliance on Russia. It’s not ideal, it’s not very clean, but it sure beats World War III.


The fossil fuel trade is a huge and slow moving network. Fuel is not traded on the spot, but mostly through titanic international supply agreements. As ‘spot’ purchases are subject to availability and price fluctuation, countries look to futures markets to secure supply more affordably. Another factor is the cost of scale: a nation needs to be pretty sure it wants to keep burning petrol, for example, before it builds another refinery.

And then we have production. There are still vast reserves of fossil fuels around the world, but the rate of extraction is (thankfully for global warming) quite slow. Since the amortisation (paying off) of the expensive facilities that move, refine, and burn fossil fuels takes many years, extraction is meant to closely track demand. And that turns the trade agreements that move fossil fuels into a zero sum game: for example, if the USA wanted to provide more gas to Europe, it would have to supply less to other partners, say, Japan. Keep that in mind, it will become important later.

Desperate measures

Brokdorf nuclear power plant in Germany; preussenelektra.de.

Keeping in mind this zero-sum trading entrenchment, let’s get back to our theme of what Europe could do to get off Russian energy imports.

We spend our fuel on a plethora of activities but a lot of it goes into electricity generation. Given the centralisation of generation into power plants, this makes electricity a good starting point—it’ll be an easier accounting exercise than figuring out how to change consumption at individual homes, businesses, and industries (give me a couple of days to write Part 3!).

In Part 1 I plotted the fuel mix of electricity production in Europe. Let’s have another look at that:

See that (red) segment third along on the electricity bar? That’s nuclear. I am sure to lose a few environmentalist friends in the coming seconds… I want to look at how much of that gas imported from Russia we can offset by boosting nuclear electricity generation.

Europe has a long history of generating electricity in nuclear plants. It’s no surprise: nuclear energy is vastly superior than combustion. The energy contained in one kilogram of gas is 53.6 MJ (Mega-Joules); one kg of Plutonium contains 84 million MJ. Even after conversion to electrical energy, that’ll be 21 MJ vs 31 million MJ.

Nuclear is expensive, however, which often leads countries to scale down operations. Sweden decided to save the pennies by decommissioning 4.1 GW of its total 11 GW[3,4]. A more important factor in that decision tends to be safety, or at least, the perception of safety. After the Fukushima disaster, Germany opted to begin decommissioning its fleet of nuclear plants. In May 2011 it had 14 operating units in 12 stations[5]. Now it has three stations (each with a single unit) that are meant to be shut down this decade. Germany’s nuclear capacity reduced from 20.5 GW to 4 GW, and is slated to go away quite soon. Or, at least, it was: after the 28 February invasion it was reported that Germany may slow down that closure plan.

I propose to take a drastic step in the opposite direction.

Shuttered (but not yet dismantled) plants can be safely brought back online. Yes, there is danger in nuclear energy, but there is also considerable danger in Mad Vlad setting his nuclear war units to combat readiness. Same atoms, different vessel.

Let’s tally what we have:

  • Turn on the units in Sweden that were shuttered for financial reasons: 4.1 GW.
  • Turn on units and plants in Germany that were shuttered after Fukushima: 16.4 GW.
  • To keep it simple, offset just natural gas used for electricity generation.

That resulting 20.5 GW will be subject to an efficiency factor: given their risky nature, nuclear plants require maintenance to ensure safety. It is hard to gauge the proportion of up-time, so I derived a pan-european average of units currently in operation[6]. That’s a surprisingly high 74%. Multiply 365 days by 24 hours, by 20.5 * 109 Watts, and apply that 0.74 factor, and we get 133,565 kWh of idle nuclear capacity.

Let’s remove that from electricity currently generated with gas:

Fuel mix for electricity generation, plus a nuclear-offset scenario.

The set of blue bars on the left show the current mix of EU electricity generation: renewables are followed by fossils, and then nuclear. In the nuclear scenario renewables are unchanged, but we offset fossil generation with nuclear energy, thus lessening the EU’s dependence on Russian gas. Just turning on units in two countries with impeccable safety records we can offset 14% of thermal (fossil) generation.

More importantly, what proportion of Russian gas imports does this remove?

Maths warning! We can express gas in terms of gross calorific value, apply a thermal-to-electric conversion factor of 39%[7], and compare Terra-Joules for each source. For nuclear, we multiply our 20.5 GW by seconds in a year and the nuclear power plant efficiency factor of 74% (derived above) to get Joules.

Generation methodAnnual energy output
Nuclear481,000 TJ
Fossil gas2,280,000 TJ

Powering shuttered nuclear units in Germany and Sweden can offset 21% of Russian gas imports.

The big caveat here is localisation. We have just a few locations in Northern and Central Europe and transporting energy over long distances comes with losses. So this is an upper limit.

But wait, there’s more! As an aside, let’s calculate what CO2e reduction we can expect from those TJs of nuclear.

To get an emissions intensity we need to figure out what kind of plant is prevalent in the EU: open cycle (OC) or combined cycle (CC). From this Eurostat dataset it looks like a ten-to-one balance of CC to OC, which is great because they are heaps more efficient (new tech can get to 60%; Smil, 2017) and less polluting. The median unit-emissions of a combined-cycle plant are 751 grams of CO2-equivalent emissions per kWh[8]. Remember, we are offsetting 133,565 GWh.

The nuclear offset option would prevent the release of 100 million tonnes of CO2e from the atmosphere each year. This amounts to 3% of overall EU emissions, and 5% of the 2030 emissions reduction goal. Frankly, this sounds more like a winning option than a desperate measure!

Gas in another phase

Gas either flows through pipelines or is liquefied for transport over oceans. One topic that’s been discussed a lot in the past week is the potential of liquefied natural gas (LNG) to replace what is currently flowing into Europe through the Russian pipelines. The Economist published a neat summary and these clever folk at Bruegel dove deeper with some models.

In a nutshell, this is where the whole zero-sum trading game comes back to bite us. But just because break fees and exit clauses from existing agreements with non-EU partners are expensive, that shouldn’t stop us from hypothesising! It is wartime after all, and the financial cost of it spreading further (let alone the horrors of further escalation) would be titanic.

To build a toy model of offsetting pipeline gas with LNG we need two basic building blocks: production and export capacity of available LNG; and ability to re-gasify at the point of consumption.

Europe has plenty of idle regasification capacity in its current terminals (running at 45% according to that Economist summary), but not really in the right places. Turning LNG into gas in the outskirts of Athens does nothing to feed a combined-cycle plant near Wroclaw. Still, let’s run the numbers and see where they take us.

LNG production

Without going into tremendous detail, there is plenty of LNG around. But it is tied up in various contracts, increasingly in Asia. The United States, currently a big provider of natural gas to Europe, is the third biggest producer in the world, after Qatar and Australia. But according to the Energy Information Administration (EIA), a lot of liquefaction capacity is being added in 2022, of order 2.4 billion cubic feet per day (in regasified units). According to the timeline on the report a bunch of this capacity is meant to be installed already.

President Biden has signalled that his country is not able to bridge the Russian gas gap, but they can help the EU source elsewhere. Hypothetically though, what if the USA directed all that newly added capacity to Europe? How much LNG would that deliver to European terminals?

Multiplying by 365 days to get an annual (nominal) production, and converting to million cubic metres per day, we get 24.5 billion m3. The nuclear offset exercise above left us with 116 billion m3 meaning that this hypothetical redirection of increased US gas would deliver 20% of that remainder. That’s pretty good. Let’s put that all together.

With two quick measures we can potentially dump 40% of Russian gas imports. Let’s not forget that there are two sides to a trade: if this terrible invasion escalates further, Russia could just turn off the tap to counteract European military aid to Ukraine. We need to be preparing immediately.

Swapping trade parners

Nuclear and LNG provide pretty neat illustrations of how to offset gas imports. When it comes to other fossils it isn’t as simple to find short-term offsets. Oil mostly feeds Europe’s passenger car fleet, so mitigation could require behavioural change. Coal is used heavily for steel production but also for industrial process heat (e.g., making powdered milk using a cheap coal boiler), which can be electrified and powered with renewables. But that is not something we can achieve in a few months. I’ll get into all of that in the next instalment.

For now, let’s look at sourcing from elsewhere—again, contracts and exit fees apply, so this is hypothetical.

Coal

Having spent seven wonderful years in the coal-loving land of Australia that was the first partner that popped to mind. Australia’s current export volume is 390 Mt of coal (177 Mt metallurgical coal and 213 Mt thermal coal)[9,10]. Let’s focus on black coal.

Just for context and units, Australia’s easily reachable (economic) reserves are 75,428 Mt[10], 1750 times Europe’s annual import of Russian black coal. Let’s hope most of it stays in the ground. Combined annual production of black and brown coal is around 500 Mt, roughly 11 times the RU import into EU.

In this exercise we want to offset roughly 44 Mt of Russian coal imports, which represents 9% of annual production.

(I can’t believe I’m about to suggest that we dig up more turds, but moral inflexibility is a luxury of peacetime. Also, hopefully, this will be a like-for-like substitution, not a net increase in coal burning.)

Is Australia able to ramp up production by 9%? Does it have reserves of extracted coal at the ready?

Oil

Beside Russia, the United States, Norway, Saudi Arabia, and the UK are the EU’s main trade partners in oil. It takes the combined supply of these four countries to add up to Russia’s annual supply (171 million tonnes), so this will not be easy to offset.

As a rule of thumb, what proportion of each partner’s annual production would Europe have to procure to offset Russian oil?

Country2020 production
United States559,141 kt
Saudi Arabia458,135
Norway84,702
United Kingdom46,837
Source: [11]; kt stands for thousands of tonnes.

The EU would need the equivalent of 15% of production for the US and Saudi Arabia, and 20% of Norway and UK. Saudi Arabia and the United States would be the obvious starting point here. The US as the closest ally, and Saudi Arabia as an existing market liquidity regulator that releases reserves to keep prices in check. What kinds of reserves do they have?

In any case, this much of a ramp-up in production does not quite sound feasible… so I will pencil this in for the next instalment, where we will look at savings through (currently available) technology and behavioural change.

Best laid plans

Let’s refocus: why am I running these numbers? On the back of the humanitarian crisis caused by a belligerent imperialist power we are also facing a potential energy crisis of never-before-seen magnitude. Russia has in recent times weaponised, in trading terms, fossil fuel supplies—RIP the 24 energy retailers that went bust in the UK this past winter. Europe (and the rest of the world) therefore needs a viable deterrent.

I have examined two measures—turning on recently shut down nuclear power plants and replacing piped with liquefied gas—that can swiftly take the EU a significant part of the way toward independence from Russia. Nuclear power is unpalatable but surely preferable to the dire alternatives, even to the most hard-line environmentalists (like me). All this needs to happen very soon, especially given the sluggish nature of fossil fuel trade. Failing to do so could place Europe in an untenable situation of blackouts and freezing apartments next winter, all the while sending SWIFT transfers to the Russian military.

In the next instalment I will look at solutions that take effect on longer timeframes. Environmentalist friends, please stick around: it’ll be a lot of heat pumps and wind farms!

References

[1] GDP of Russian Federation, World Bank.
[2] EU trade with Russia, 2020, Eurostat.
[3] Sweden speeds up nuclear reactors closure ($).
[4] Nuclear power in Sweden, Wikipedia.
[5] Nuclear power in Germany, Wikipedia.
[6] Nuclear power in the European Union, World Nuclear Association.
[7] Tonne of oil equivalent, Wikipedia.
[8] Emission intensity, Wikipedia.
[9] Coal in Australia, Wikipedia.
[10] Coal, Geoscience Australia.
[11] List of countries by oil production, Wikipedia.

SWIFT action: Can Europe dump Russian energy imports? (Part 1)

energy

Following an initial period of utter shock, Russia’s invasion of Ukraine brought about a torrent of reaction across the globe. With new sanctions on elites, big business, and financial institutions being announced seemingly every hour, people are calling on their governments to go beyond: to a full embargo of the Russian Federation. The motivation is partly punitive, but the more practical reason is to decrease or eliminate capital available to bankroll the Russian war machine.

A worker walking past a segment of Nord Stream 2 pipe; nationalreview.com.

As the political entity closest to the conflict, the European Union is moving fast to block Russian companies and individuals from financial reserves. The oil-slicked elephant in the room is Europe’s reliance on Russia for fossil fuels—even as the war rages, pipelines on Ukrainian soil transport natural gas from Russia to Europe. Over the past few days I’ve wondered how big is this reliance, how entrenched, and how soon, if at all, could it be reversed? So I sat down to run the numbers and I am very keen to hear your thoughts.

The analysis will come in three segments. In this first part, I have fetched all basic data I’ve been using to make sense of the situation (don’t worry, there will be more exciting data processing in Part II). Then I’ll examine what kind of action the EU could take in the coming year or so to decrease reliance on Russian energy imports. And in the last part I’ll throw some ideas around about a plausible future without fossils, at least none from the Russian Federation.

Europe’s reliance on Russian fossils

It is hard to understate how big a deal Russian oil, gas, and coal are to the EU 27. Eurostat[1,2,3] provides excellent access to these data. One caveat for this analysis is that the latest complete time series is for 2020, which was a bonkers year for energy data on account of that plague. But it represents the most recent state of affairs in international trade.

Looking at the top-five suppliers we get a clear frontrunner:

For the screen readers, Russian imports into the EU account for:

  • 46% of coal (44,000 thousand tonnes of a total import of 97,000).
  • 38% of gas (153,000 million cubic metres of a total import of 401,000).
  • 23% of oil (171,000 thousand tonnes of a total import of 747,000).

These values are more or less stable against fluctuation: oil and gas show the same proportions in 2019, although the share of Russian coal increased: it was 41% in 2019.

It is hard to imagine a closer trading partner, especially in a primary industry. Before we imagine reshuffling the world of energy trade, let’s look at how the EU uses fossil fuels.

Modes of energy usage

Electricity and heat generation

In the presence of heat, carbon molecules in coal, oil, or gas react with oxygen in the air to release massive amounts of energy. We harness this energy either directly, in the form of heat, or indirectly, applying this heat to water to produce steam and spin a turbine, to generate electricity.

Electricity is plainly understood—flick a switch and the lights come on— so let’s look at heat for a moment: the biggest industrial processes that depend on this are metallurgy (the coking of steel and smelting of aluminium) and cement production. Kind of a big deal! Let’s review 2020 generation of electricity and heat[4]:

For screen readers: in 2020, EU-wide fossil generation was 959 TWh of electricity and 355 TWh of heat. That’s a lot of TWh, a tricky number to parse. What proportion of the generation mix did fossils represent?

About a third of electricity generation came from fossils, with renewables representing almost half and nuclear around 15% of the energy mix. Just over half of the heat generation was fossil-derived, which is to be expected as coke and coal dominate steel and cement production.

Transport

The next crucial activity that relies on fossil combustion is the transportation of people and goods. When we tally the petrol and diesel that moves our cars, the jet fuel that takes us to our holidays and business meetings, and the shipping fuel that moves our stuff from the factories to the shops, we are met with quite an interesting statistic:

20192020
Road transport252,220 ktOE220,212 ktOE
Aviation6,5113,081
Maritime4,2123,627
TOTAL262,943226,920
Consumption in kilo-tonnes of oil equivalent (ktOE). Source: [5]

EU countries import crude oil that they then refine for combustion. In 2020, Russian exports amounted to 170,566 ktOE, equating to (brace for impact of statement)…

75% of transport fuel burned in the EU 27 in 2020.

(In the table above I have provided 2019 values for contrast, since transport was so deeply affected by the COVID-19 pandemic. The proportion of crude sourced from Russia in 2019 was 74%.)

What are the options here?

For anyone who wants the EU to immediately turn off the tap on Russian fossils these figures surely paint a grim picture. That trade route cannot be immediately abandoned without causing havoc to people in the EU—I don’t mean slight deprivation and sacrifice, I mean blackouts and people freezing in their apartments.

But this is not just about the immediate term. An embargo on the Russian Federation can take the form of a sudden cessation of non-essential trade, followed by a gradual realignment of trade routes, generation methods, and efficiency measures. In the following instalments I will cover two broad topics:

First I will cover some (potentially unpalatable) measures the EU can take in the immediate term to avoid a greater crisis.

  • The role nuclear energy can play in the near term.
  • Which existing trade partners could step up fossil fuel supply.

Then, using the above as stepping stone, I will consider how we can set up a great realignment of energy generation and consumption for a future based on renewables.

Stay tuned!

Notes and references

  1. Imports of solid fossil fuels by partner country
  2. Imports of natural gas by partner country
  3. Imports of oil and petroleum products by partner country
  4. Complete energy balances
  5. Oil and petroleum products

NB: My day job as an energy analyst does not normally feature on this site, but this being an extraordinary circumstance I thought I’d fuse my two worlds. I normally would have analysis like this peer-reviewed before publishing, but in this case I want to immediately start communicating with people about what this means. I will be updating this text if I (or you!) happen to find any discrepancies.

Data sources and fuel codes

There is nothing particularly challenging about the data I used in this post: it’s all from Eurostat. It can get a little confusing to navigate the data when it comes to the fuel codes, or SIEC: standard international energy product classification codes. You can find more info on this page, and a list of dictionaries here.

  • To create Figure 1, Proportion of supply per fuel and partner, I used overarching material codes to represent coal (C0000X0350-0370), oil (O4000), and gas (G3000).
  • For Figure 2, EU-wide thermal generation in 2020, I used the same SIECs but O4000XBIO for oil, which excludes biogenic oil, as O4000 was not available—it looks like biofuel is not used for thermal generation.
  • Figure 3, Proportion of generation by fuel type in 2020, uses the same data as Fig. 1.
  • The tabulation of transport fuels uses data straight from the source. In the order that they appear, the categories are Final consumption – transport sector – road – energy use, Final consumption – transport sector – domestic aviation – energy use, and Final consumption – transport sector – domestic navigation – energy use.