

Following an initial period of utter shock, Russia’s invasion of Ukraine brought about a torrent of reaction across the globe. With new sanctions on elites, big business, and financial institutions being announced seemingly every hour, people are calling on their governments to go beyond: to a full embargo of the Russian Federation. The motivation is partly punitive, but the more practical reason is to decrease or eliminate capital available to bankroll the Russian war machine.
As the political entity closest to the conflict, the European Union is moving fast to block Russian companies and individuals from financial reserves. The oil-slicked elephant in the room is Europe’s reliance on Russia for fossil fuels—even as the war rages, pipelines on Ukrainian soil transport natural gas from Russia to Europe. Over the past few days I’ve wondered how big is this reliance, how entrenched, and how soon, if at all, could it be reversed? So I sat down to run the numbers and I am very keen to hear your thoughts.
The analysis will come in three segments. In this first part, I have fetched all basic data I’ve been using to make sense of the situation (don’t worry, there will be more exciting data processing in Part II). Then I’ll examine what kind of action the EU could take in the coming year or so to decrease reliance on Russian energy imports. And in the last part I’ll throw some ideas around about a plausible future without fossils, at least none from the Russian Federation.
Europe’s reliance on Russian fossils
It is hard to understate how big a deal Russian oil, gas, and coal are to the EU 27. Eurostat[1,2,3] provides excellent access to these data. One caveat for this analysis is that the latest complete time series is for 2020, which was a bonkers year for energy data on account of that plague. But it represents the most recent state of affairs in international trade.
Looking at the top-five suppliers we get a clear frontrunner:

For the screen readers, Russian imports into the EU account for:
- 46% of coal (44,000 thousand tonnes of a total import of 97,000).
- 38% of gas (153,000 million cubic metres of a total import of 401,000).
- 23% of oil (171,000 thousand tonnes of a total import of 747,000).
These values are more or less stable against fluctuation: oil and gas show the same proportions in 2019, although the share of Russian coal increased: it was 41% in 2019.
It is hard to imagine a closer trading partner, especially in a primary industry. Before we imagine reshuffling the world of energy trade, let’s look at how the EU uses fossil fuels.
Modes of energy usage
Electricity and heat generation
In the presence of heat, carbon molecules in coal, oil, or gas react with oxygen in the air to release massive amounts of energy. We harness this energy either directly, in the form of heat, or indirectly, applying this heat to water to produce steam and spin a turbine, to generate electricity.
Electricity is plainly understood—flick a switch and the lights come on— so let’s look at heat for a moment: the biggest industrial processes that depend on this are metallurgy (the coking of steel and smelting of aluminium) and cement production. Kind of a big deal! Let’s review 2020 generation of electricity and heat[4]:
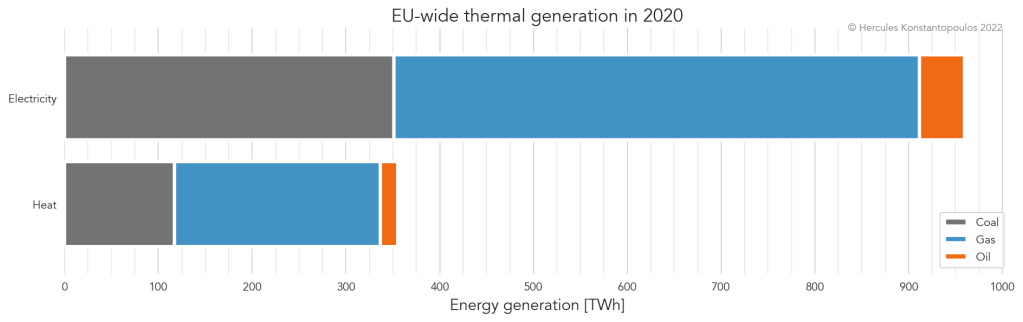
For screen readers: in 2020, EU-wide fossil generation was 959 TWh of electricity and 355 TWh of heat. That’s a lot of TWh, a tricky number to parse. What proportion of the generation mix did fossils represent?

About a third of electricity generation came from fossils, with renewables representing almost half and nuclear around 15% of the energy mix. Just over half of the heat generation was fossil-derived, which is to be expected as coke and coal dominate steel and cement production.
Transport
The next crucial activity that relies on fossil combustion is the transportation of people and goods. When we tally the petrol and diesel that moves our cars, the jet fuel that takes us to our holidays and business meetings, and the shipping fuel that moves our stuff from the factories to the shops, we are met with quite an interesting statistic:
| 2019 | 2020 | |
|---|---|---|
| Road transport | 252,220 ktOE | 220,212 ktOE |
| Aviation | 6,511 | 3,081 |
| Maritime | 4,212 | 3,627 |
| TOTAL | 262,943 | 226,920 |
EU countries import crude oil that they then refine for combustion. In 2020, Russian exports amounted to 170,566 ktOE, equating to (brace for impact of statement)…
75% of transport fuel burned in the EU 27 in 2020.
(In the table above I have provided 2019 values for contrast, since transport was so deeply affected by the COVID-19 pandemic. The proportion of crude sourced from Russia in 2019 was 74%.)
What are the options here?
For anyone who wants the EU to immediately turn off the tap on Russian fossils these figures surely paint a grim picture. That trade route cannot be immediately abandoned without causing havoc to people in the EU—I don’t mean slight deprivation and sacrifice, I mean blackouts and people freezing in their apartments.
But this is not just about the immediate term. An embargo on the Russian Federation can take the form of a sudden cessation of non-essential trade, followed by a gradual realignment of trade routes, generation methods, and efficiency measures. In the following instalments I will cover two broad topics:
First I will cover some (potentially unpalatable) measures the EU can take in the immediate term to avoid a greater crisis.
- The role nuclear energy can play in the near term.
- Which existing trade partners could step up fossil fuel supply.
Then, using the above as stepping stone, I will consider how we can set up a great realignment of energy generation and consumption for a future based on renewables.
Stay tuned!
Notes and references
- Imports of solid fossil fuels by partner country
- Imports of natural gas by partner country
- Imports of oil and petroleum products by partner country
- Complete energy balances
- Oil and petroleum products
NB: My day job as an energy analyst does not normally feature on this site, but this being an extraordinary circumstance I thought I’d fuse my two worlds. I normally would have analysis like this peer-reviewed before publishing, but in this case I want to immediately start communicating with people about what this means. I will be updating this text if I (or you!) happen to find any discrepancies.
Data sources and fuel codes
There is nothing particularly challenging about the data I used in this post: it’s all from Eurostat. It can get a little confusing to navigate the data when it comes to the fuel codes, or SIEC: standard international energy product classification codes. You can find more info on this page, and a list of dictionaries here.
- To create Figure 1, Proportion of supply per fuel and partner, I used overarching material codes to represent coal (
C0000X0350-0370), oil (O4000), and gas (G3000). - For Figure 2, EU-wide thermal generation in 2020, I used the same SIECs but
O4000XBIOfor oil, which excludes biogenic oil, asO4000was not available—it looks like biofuel is not used for thermal generation. - Figure 3, Proportion of generation by fuel type in 2020, uses the same data as Fig. 1.
- The tabulation of transport fuels uses data straight from the source. In the order that they appear, the categories are Final consumption – transport sector – road – energy use, Final consumption – transport sector – domestic aviation – energy use, and Final consumption – transport sector – domestic navigation – energy use.

Hi IrakusDo you know this author? A collaboration maybe?
https://spectrum.ieee.org/russia-ukraine-fossil-fuels.
Kind Regards
LikeLike
Yes, Smil is a legend! I’m actually reading Energy and Civilisation (properly, no skipping sections!) right now.
LikeLike